Do you have a comprehensive understanding of Google Analytics tracking? If you do then you probably have too much time on your hands. Most small business owners are too busy running their businesses to learn all of the ins and outs of Google’s incredibly detailed traffic evaluation tool much less keep up with the changes.
 For the small business that doesn’t have the time or the expertise to do detailed analysis of Google analytics there are a few key metrics to keep tabs on that can give you a quick idea of how your site is performing. Use these indicators to tweak your site and you’ll be optimizing performance without spending half your work day trying to cipher Google reports.
Important Google Analytics Metrics Worth Paying Attention To
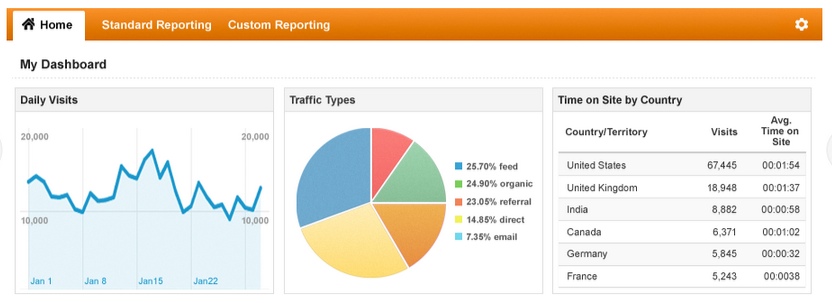
Visitor Time on Site
Generally speaking, the longer a visitor stays on your site the more likely they will perform an action you want them to do like sign up for an email list, request a quote or make a purchase. The reasoning is pretty simple. In this age when there are literally millions of pages competing for traffic a visitor is not going to spend more than three or four seconds deciding whether to stay and read the content or not.
If your content grabs the attention of the visitor and is informative and engaging, odds are you’ll keep the visitor on the page. The trick is to get him or her to move on to another page.
The social media site Stumble Upon reports that their average visitor spends just over 30 minutes per visit. That’s forever in internet time. The driving force behind Stumble Upon’s amazing time on site stat is that all of the content has been referred or vetted by Stumble Upon members. This third party endorsement is the beauty of social networking.
You can do the same thing (on a smaller scale) by ensuring that every page allows for easy sharing by the reader.
Secondly, Stumble Upon has an exceptionally intuitive and well organized navigation layout and this is something you can do just as well as them. An intuitive navigation and links within a page to additional page makes it easy for a visitor to “get more.”
Bounce Rate
Bounce rate refers to the percentage of people who arrive and depart on the same page. The assumption is there was nothing on the page that either engaged the reader or gave him or her reason to move on to another page.
If you have a page with a high bounce rate it’s time to tweak it particularly if it is getting good traffic. The most common reason for visitors departing is that the page title, meta description and headline don’t match the actual content. For example if your page title is “best options for kitchen flooring” and the content only talks about laminate then you haven’t delivered on the promise of the headline. Fix it.
The Mobile Revolution
Tracking mobile traffic is already an important metric but it’s going to get even more important in the future. If you have responsive programming your mobile visits will be averaging nearly 40% of your traffic. In 2014 the internet will be accessed more frequently by mobile devices than PCs or laptops. Your mobile traffic is going to grow…and it’s different.
Set up a mobile dashboard on Google analytics. Using this dashboard you’ll discover how much traffic you’re getting, the keyword phrases being searched (they will be different than those a PC visitor will use) time on page (it will be less because they are in a hurry) and bounce rate.
Use this data to streamline your mobile optimized pages. Keep content tight, brief and to the point. Use sub headers and bullet points for easy, quick scanning.
So if you can keep an eye on time on site/page, bounce rate and tracking your mobile activity you’ll have a good overview of your site’s productivity. You don’t have to be a geek to be good at Google analytics tracking. Get professional assistance with the help of Google Analytics tracking services.
Do you need to set your business up with Google Analytics?
Google walks you through exactly what to do, step-by-step, right here.
Want to embed this infographic on your website?

